Every week I gather data about my business and enter it into a spreadsheet that estimates my weekly net profit.
You can read more about why I do weekly trend reports here.
![]()
Download the Amazon Trend Report Template here.
All the numbers in the template and shown below are fictional.
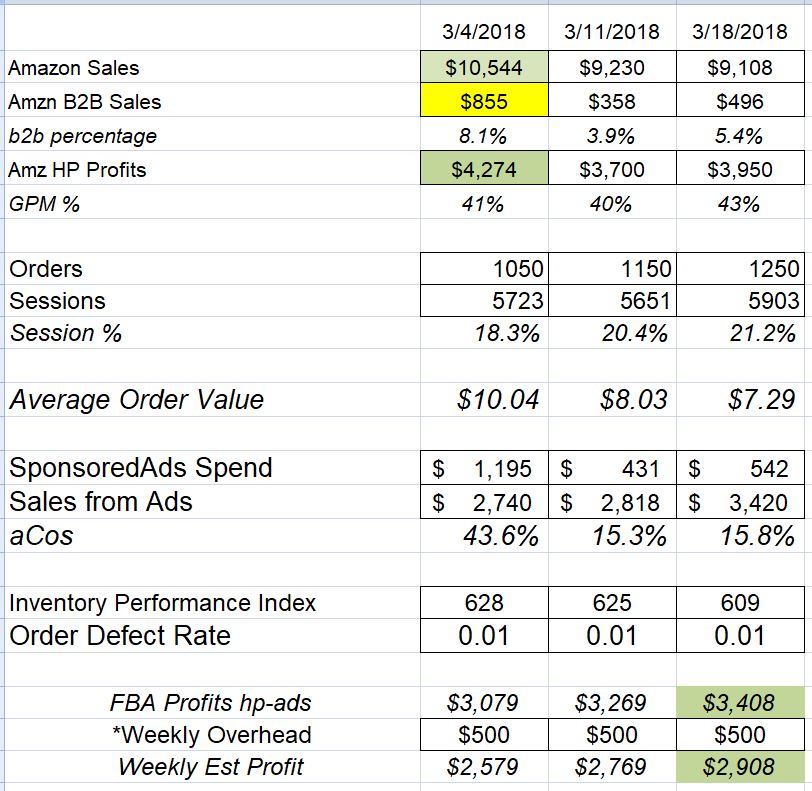
On the surface, this looks like a simplistic report, but I have found the process of doing this every week allows me to develop a deeper understanding of my business. Let’s walk thru the numbers and where they come from and why I track them.
An important part of doing a trend report is to have consistency in your data. I try to always get my data from the same source and to prove the source to make sure it is accurate. Amazon is well known for moving things around in Seller Central – make sure you have a consistent place to get your numbers and if they move when you find them make sure they are consistent with what you have been using. Starting at the top, lets take a look at where I gather the data.
We begin in Seller Central – Business Reports – by Date – Sales and Traffic – By Week
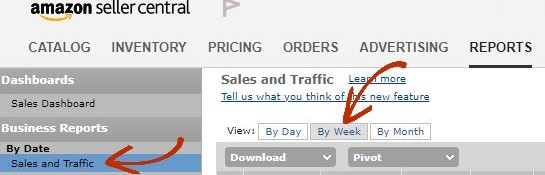
Amazon uses a Sunday – Saturday week, the date you see is the beginning of the week, Sunday. When compiling the rest of your data use the Sunday to Saturday dates to correlate with this income.
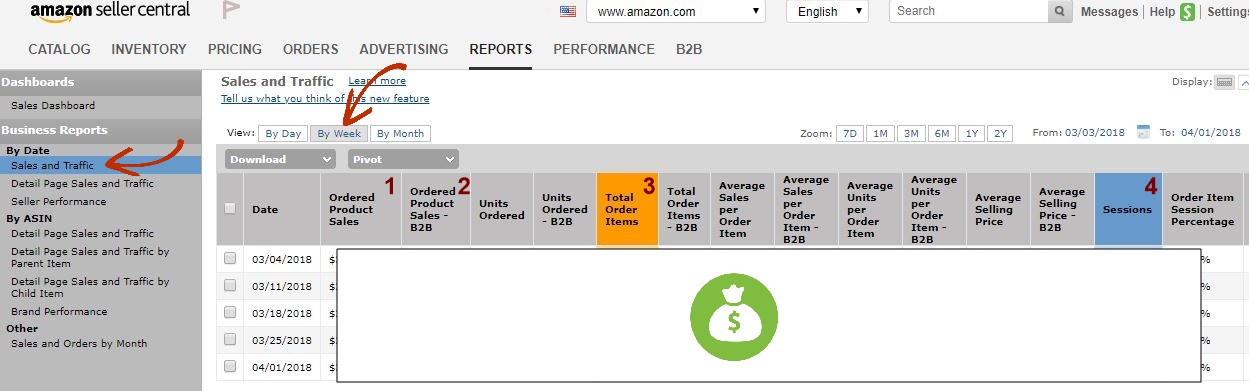
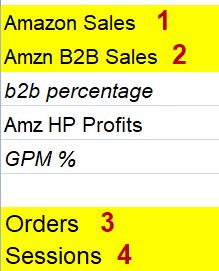
From the Sales and Traffic by Week screen, you will pick up 4 pieces of data – Amazon Sales, Amazon B2B Sales, Orders and Sessions.
B2B sales is not relevant to everyone, but it is important in my business so we track it. Basically any number that I think is important and especially any number we are actively trying to grow – we track. If you don’t find B2B important to you, then eliminate it from the report.
The next line is tricky. Amazon Profits – I want this number to be sales less Amazon fees less product costs. I use Hello Profit to monitor and calculate my estimated profit. For me this number is easy to get by opening Hello Profit and filtering by the dates of the previous week and clicking on that little ‘i’ to see the details. There are many other software services that track your profits by allowing you to enter your actual product costs which is the number that Amazon does not have.
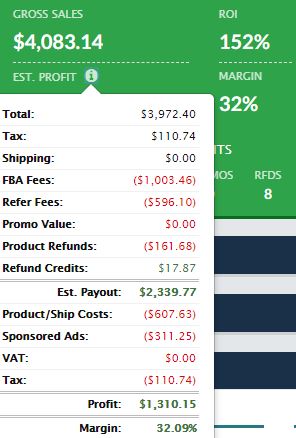 The reason I stick with Hello Profit is that when I filter the data by the week I am looking at in Amazon, my sales numbers agree. Sometimes they may be off by $50 or so, but nothing major. I have tested several other Amazon softwares that show sales and costs and I have seen huge discrepancies from what I see in Seller Central. One of the most important reasons I do my weekly trend report is to make sure the data I look at in other sources is correct. But you still have to figure out what is included in number, for example, Amazon does not include sales tax in the Product Sales number, but Hello Profit does on the main dashboard and you have to drill down to see Sales without sales tax. I didn’t know this for a few weeks and was upset that my sales numbers didn’t match until I realized the difference was sales tax. There is a setting in Hello Profit to remove sales tax from your profit calculation, but it still shows as Sales on the main dashboard – very important to know!
We know how often Amazon changes where data is in Seller Central, I can’t imagine how difficult it is to keep an api working and pulling the correct data from Amazon. We see changes all the time and it is our job to know if information is reliable and accurate. Since I do this report every week, I know when Hello Profit has a problem with their data. I am probably their least favorite customer because I will open a support ticket as soon as a number is off. Recently they even notified me in advance when there was a problem – they knew come Monday morning they would be hearing from me when the advertising cost feed was inaccurate.
The point here is to realize that 3rd party services have a daunting task to keep up with Amazon’s data feed. In the end it is our responsibility to know our data and verify our sources. Unfortunately with Amazon this takes a constant and consistent effort which makes the weekly trend report all the more valuable to an entrepreneur.
Back to the task at hand, you need to get your product costs and Amazon fees from somewhere. You can calculate product costs yourself and if you have a small number of skus then that is easily done. Your Amazon fees for the week are found in Seller Central – Reports – Payments – Date Range Reports. Download the report the week you are working on and total it to find all of your Amazon fees associated with those sales or use a software service that tracks this data for you like Hello Profit.
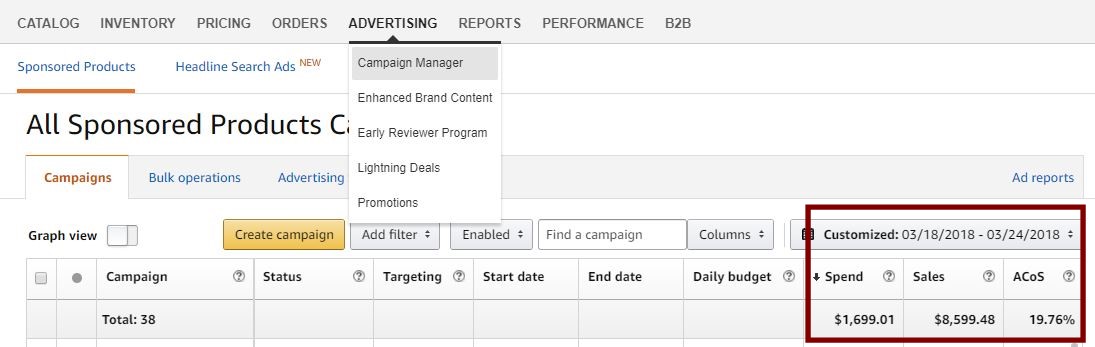
Next, get your Sponsored ad spend and sales numbers from Seller Central – Advertising – Campaign Manager – Customized Date. I choose to get this number from Seller Central even though it appears in Hello Profit. This is a newer feature in Hello Profit and while it was working well for a time, at this moment the data is not consistent with Seller Central. You see my point of knowing where the data comes from – don’t trust a secondary source without testing it and spot checking it – things change!
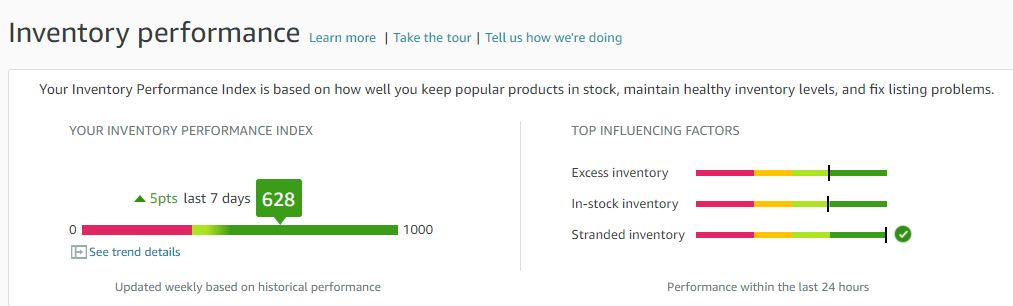
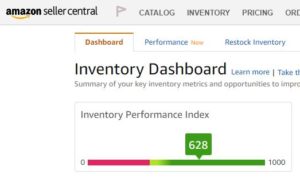 Next up is our Inventory performance metrics in Amazon. Seller Central – Inventory Planning which opens to the dashboard to show our Inventory Performance Index. This is Amazon’s rating for how well you keep popular products in stock, maintain healthy inventory levels, and fix listing problems. Since Amazon created an Index to rate this then it is worthy of monitoring. If this number fluctuates dramatically then I want to know when it happened and can drill down into the details – is there a problem that needs to be addressed immediately? If Amazon rates us, then we need to know this and follow this trend.
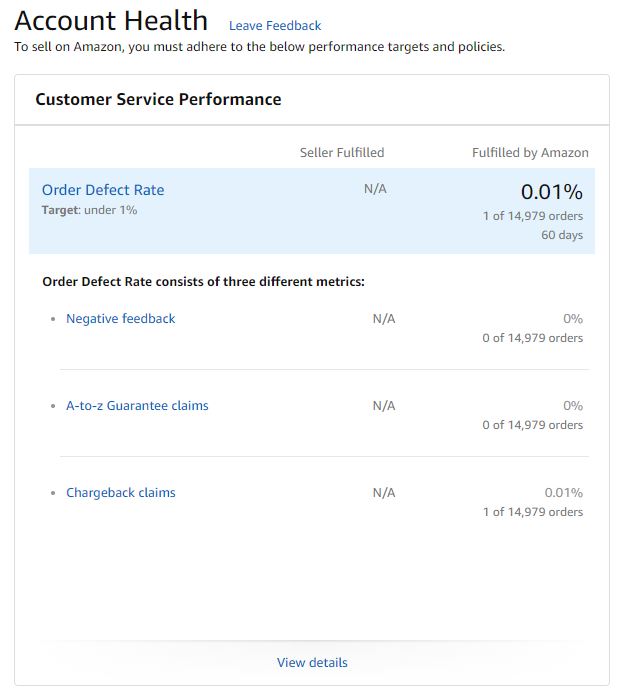
Last stop is Seller Central – Performance – Account Health this stop is more of a visual check in and the only way I can make sure I do it is to have a number to records in my trend report. You might find a different number on this screen to record. Anything that you need to improve or work on is a good number to track.
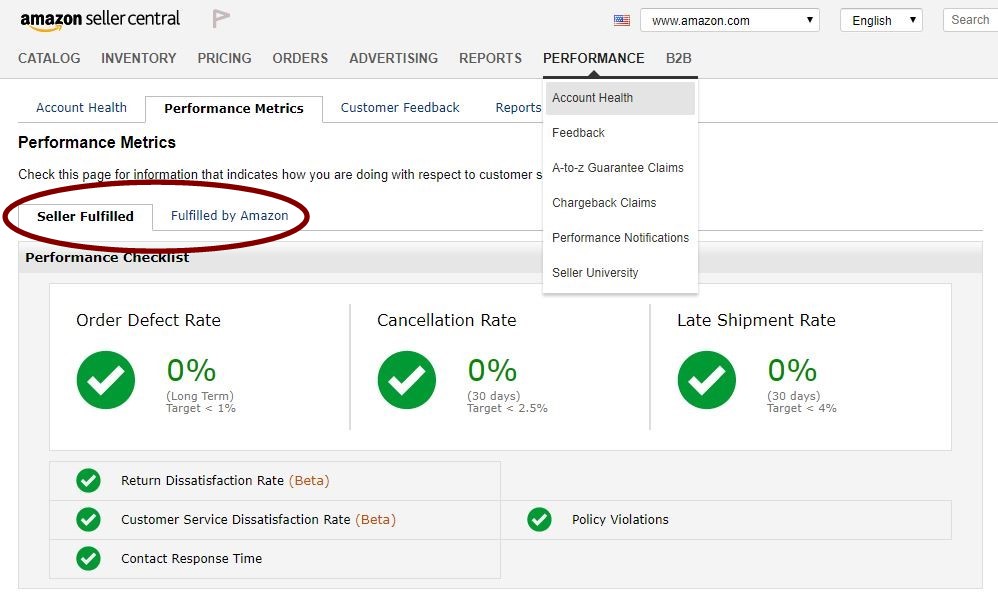
While you are here, click over to the Performance Metrics tab and make sure you have all green check marks. This is where you can see a performance problem and notice any changes in how Amazon is rating your Seller Performance. Notice there are two tabs here for Seller Fulfilled and FBA, check both.
5/12/2018 Updated to Amazon Weekly Trend Report. The template now includes a line for Ad Spend / Total Sales. After hearing Brad Moss at Seller’s Summit, I learned this gives a broader indicator of how much your ad spend is also impacting organic sales on Amazon – the flywheel effect. Another benefit of the WTR when you learn something new you have a place to insert it that you are already familiar with – now I can see that percentage along with aCos and other numbers I follow – it is all about context. Easier to learn a new thing in a familiar context.