Every week I gather data about my business and enter it into a spreadsheet that estimates my weekly gross profit. This report has evolved over the last nine years that I have been doing it. Initially I started this to learn more about the company I had just purchased, but I found that I have never stopped learning and having deeper insights by continuing the discipline of doing this report every Monday morning.
You can read more about why I do weekly trend reports here.
![]()
Download the excel Template for E-Commerce Weekly Trend Report.
All the numbers in the template and shown below are fictional.
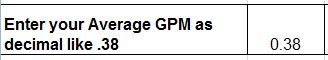
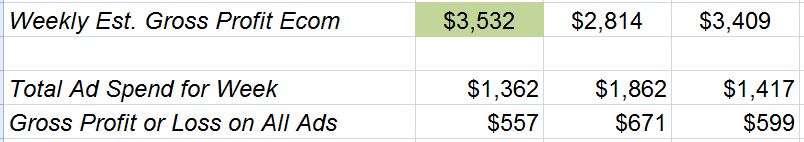
At the bottom of the Template you need to input your average gross profit margin – this is used to estimate your gross profits. For me, advertising is our biggest expense so I want the Weekly Trend Report to estimate gross profit for the week less advertising. The estimated Gross Profit at the end of the report is with product costs and advertising costs deducted.
Each week I have a report emailed to me out of our shipping software that summarizes our number of orders, gross sales and shipping income and Google Analytics (GA) offers scheduled emailed reports or you can just save the reports in GA so you can easily access them each week. Reports sitting in my inbox on Monday mornings are the best reminder to do my Weekly Trend Report and allow it to be done efficiently.
Let’s walk thru the numbers and where they come from and why I track them.
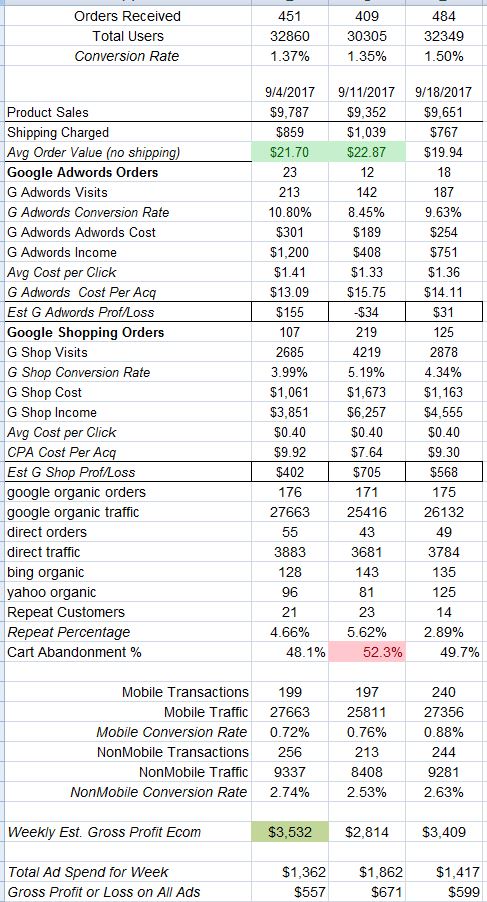
The number of orders and sales dollars comes from our internal sales report. For the sales dollars, I do not include shipping revenue in sales since we will be using the sales number to calculate our gross profit.
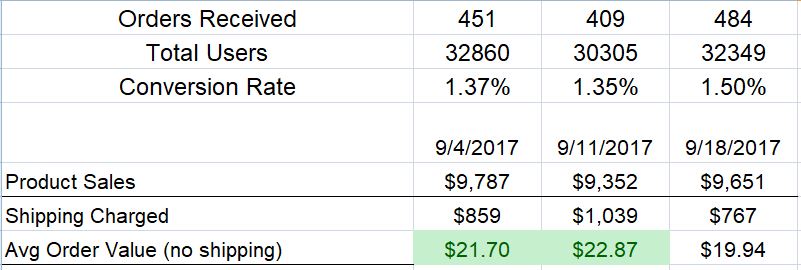
The number of Users on our site comes from GA – Audiences – Overview. I choose to segment our Audience by e-commerce visitors versis blog visitors (our blog is on the same domain as our e-commerce site so I segment that traffic) and only include e-commerce Audience on this report. Conversion Rate and Average Order value are calculated fields. Some rows like AOV have Conditional Formatting to highlight green if they are trending above average or red if they are below average.
As I mentioned advertising is our biggest expense and seems to be the one thing that can go awry the quickest. We monitor our advertising in the Weekly Trend Report to make sure it is performing as we expect and to have an understanding if the orders we are acquiring from advertising are profitable after we take out product cost and advertising spend. Each ad platform that we use has a ‘chunk’ in the report. For Google advertising this data is gathered from GA – Acquisition – Adwords – Campaigns. The first few weeks you use this GA report, cross reference it with Adwords and make sure your ad spend is reported correctly in GA.
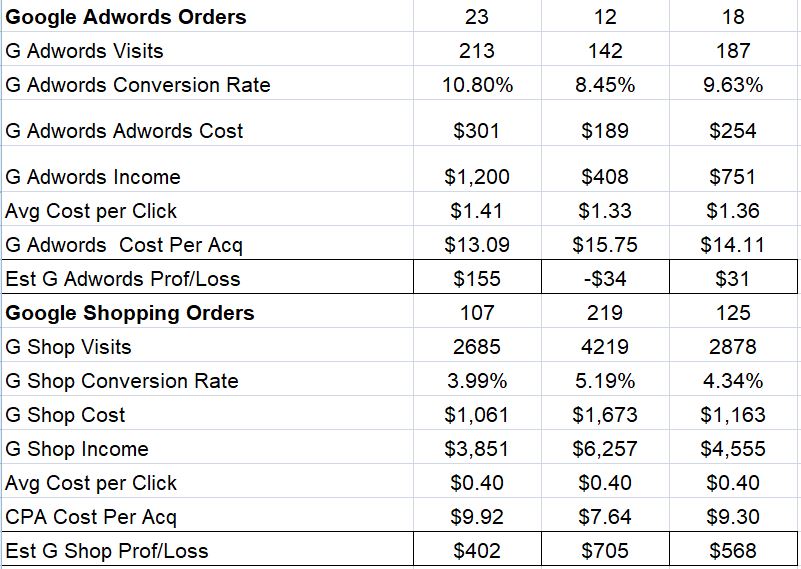
If you are using additional ad platforms like Bing and Facebook, then you would replicate this chunk for each platform and get your cost data from the ad platform and your conversion data from GA.
This section of my Weekly Trend Report has alerted me to problems in ad campaigns many times. When spend gets out of control because of some change on the platform or when conversion drops because of a new competitor. Having a succinct way to check your ad spend every week is a life saver towards profitability and towards understanding of what your advertising really costs you. You learn quickly when you realize that you are shipping orders at a loss when you factor in ad spend and product costs.
If you outsource management of your ad campaigns, this part of the report helps you have a quick reference to their performance in terms that make sense to you. Agencies send you long reports that can be overwhelming, therefore, having a report in a format that makes sense to you is helpful for guiding them to the results you want.
Next up is the traffic chunk from GA – Acquisition – All Traffic – Source Medium. I love the GA Source/Medium report and feel the report deserves attention. We only summarize a small part of the report on the Weekly Trend Report, but I actually review the whole report each week and feel it gives one of the best overviews of how your site is generating income. Trying to wrap your head around how advertising ends up effecting organic and direct orders is a pretty large order and not something that is the same for every site. As you grow your site and increase or decrease your ad spend it is insightful to learn how it effects other parts of your site.
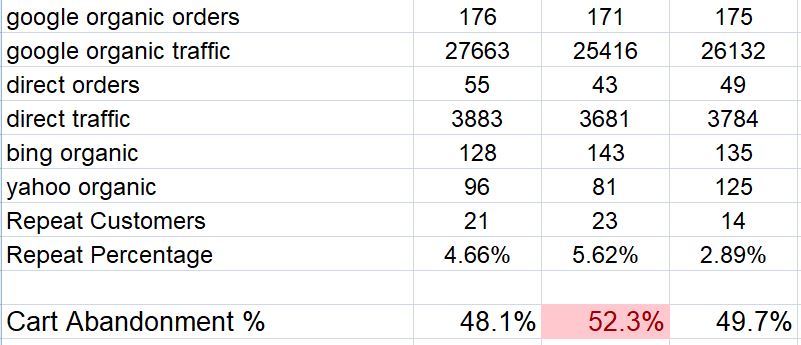
Repeat Customers is the count of orders from customers who ordered before and is from our shipping software. The Repeat Percentage is a calculated field from the repeat orders divided by total orders. If your type of product allows for repeat business then this is an important metric to follow.
Cart Abandonment comes from our shopping cart. The row is set to highlight green or red if it is trending above or below average. Many times I have noticed cart abandonment peaking at the same time that an ad channel is under performing which alerts me to a new competitor on that ad channel. This is an instance of learning how metrics correlate and is one of the most important reasons for doing the trend report.
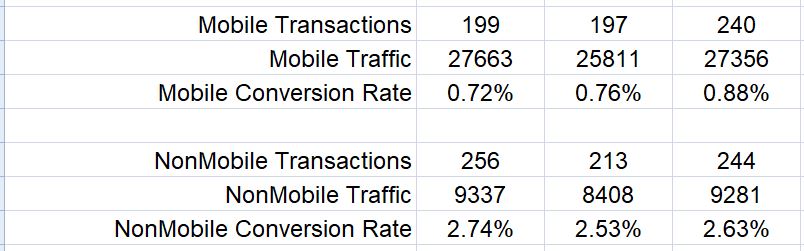
I don’t think Conversion Rate can be looked at for your full site without breaking it down for mobile and desktop (I choose to lump tablet in with desktop). If our conversion rate drops that can alert us to a problem in our cart and this breakdown indicates where to start looking for an issue.
Learning the conversion rate trends for my site has helped us evolve our advertising spend for mobile. After years of following these trends, I have been able to develop a better understanding of our customers and how our most valuable customers always come in on desktop. These types of insights develop over time of following this data set.
We are getting to the end … time for the grand finale! Bringing it all together for the bottom line. The weekly estimated gross profit row has conditional formatting to alert to a new high. I use my Monday morning time with my trend report to gain insight and understanding while making sure I know if we are profitable. I also summarize all the ad channels together for what we spent last week on all advertising and whether is was profitable after ad spend and product costs.
You can start with this format or just one small chunk, but the real point is to have you decide the metrics that most important to you and your business. Putting metrics in a format that speaks to you is paramount, therefore, don’t rely on this format if you find it uninspiring. But do commit to a weekly data set that you are willing to track – that is where the deep insights and knowledge of your business will come from.