I had the pleasure of speaking at Sellers Summit last week about ‘Unlocking Your Profit Potential’. Since I wanted to give an overview of my thought process and some actionable steps, I had to cut some details from my presentation. This post explains which metrics I use for Amazon products and how I try to use this limited data to build the most profitable catalog of items.
I think of my products like a baseball team. I love how baseball is statistics driven and how players are rated against each other based on those stats and that is how I run my business. Think Moneyball for small business!
These six stats when looked at together for each product give me a ton of insight into what we need to focus on and helps prioritize what we will work on. The process of comparing those stats against other products and against our ‘team average’ also helps point out any weaknesses in our product selection. The reason this works well for us is that all of our products are related and in the same niche – this method would not work if you were in a variety of categories with unrelated items.
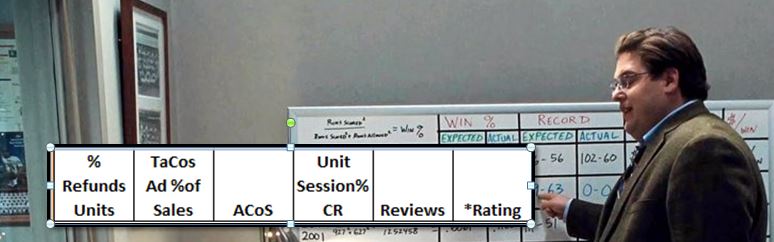
Before we start talking insights, here are the definitions:
% Refunds Units – Number of Units Refunded / Total Number of Units Sold
TaCos Ad % of Sales – Total Ad Spend / Total Sales
ACoS – Total Ad Spend / Sales generated by those Ads
Unit Session% CR – Units Ordered / # of Sessions (old school ecommerce thinks of this as Conversion Rate)
Reviews – how many reviews this product has
*Rating – what is the star rating of the reviews for this product
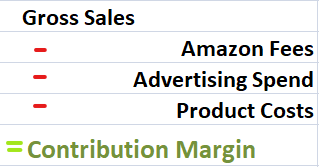
Contribution Margin
Below is a sample set of data of a few products along with our ‘Team Average’ for our full catalog. What we are looking for is anything that stands out as unusual in comparison to our other skus. We use this data to look for opportunities and weaknesses.
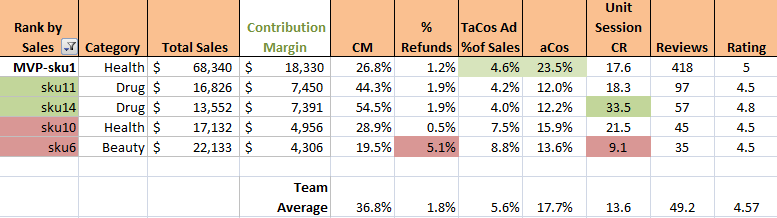
Looking at sku6, we see an unusually high number of units returned compared to the rest of our products along with a low Unit Session%. Since these two numbers are together performing much worse than the rest of our ‘team’ – is there anything I can learn from this or fix? We dug a little deeper and looked at some of the reasons for returns and found they stated it was a different size than they expected. Even though we stated the size in text, we did not communicate it strongly enough and have since added more size related images and more content to communicate it. We feel certain fixing our returns issue will also help increase the Unit Session % since we had left the customer wondering what they were getting.
For all advertising decisions, we feel like we make the best decisions by looking at these stats together. Initially we were making advertising decisions based solely on ACoS, but we have found that is a misleading single statistic and just driving down ACoS is not our goal. Look at our MVP-sku1 which is the item that delivers us the most Contribution Margin. If we only looked at ACoS then we would think it was higher than our team average and we could save money by reducing ad spend. However, look at the TaCos … it is below our team average and it is our best selling product – so the ad spend is probably influencing our organic rank and driving sales that way. If we reduced our ACoS, we could also impact our organic sales and end up decreasing our Contribution Margin.
Looking at ACoS by itself is ignoring too many other important factors. Here are some examples where ACoS alone can lead you astray:
- if my Unit Session % is low, why spend more money driving traffic to that page than another page? Fixing a low Unit Session % can make our ad spend more effective
- if ACoS is okay, but TaCos is really high. We are probably probably propping the product up with advertising and it is not getting any organic traction. Long term this drains Contribution Margin
- ACoS is okay, but high Returns. Those ad driven sales cost you more money with the return rate
- *Rating – if our star rating drops below 4 we decrease ad spend until we fix the issue. A low star rating on Amazon will obviously kill conversion rate, so fix the issue before continuing a normal advertising spend
- if TaCos is really low, we might be able to increase ad spend beyond a normal ACoS level and get even more traction organically
TaCos Total Advertising Cost of Sales is a super helpful metric and should be considered with all advertising decisions since it measures advertising’s true impact on total sales. Want to understand more about TaCos, here is more reading
Teikametrics – Illuminating Total Amazon Advertising Performance
TACos and Amazon: The Metric That Considers Your Organic Sales
I do not use Teikametrics software and it is not necessary for computing TaCos, but you do need to know your ad spend for each product and then divide that by total product sales. So TaCos are easy to get, but a little harder to understand which is why it helps me to see ACoS and TaCos side by side for each product along with our Contribution Margin of the product – seeing the data together has helped me understand how it works.
And that is why I do these data compilations and comparisons – I can get deeper insights into what is working in our catalog and make small adjustments along the way to get the results I want.
Back to baseball – I want to build an All Star Team – that Team is my product catalog. Every player (product) on my team has to earn their spot and deliver their value. Comparing each of our products to each other on several metrics allows me to see a bigger picture and have deeper insights which I am hoping leads to better decisions. Every product in our catalog is on the line when we do a catalog review – managing an All Star Product catalog takes work, but so far the results have been worth it.